Summary
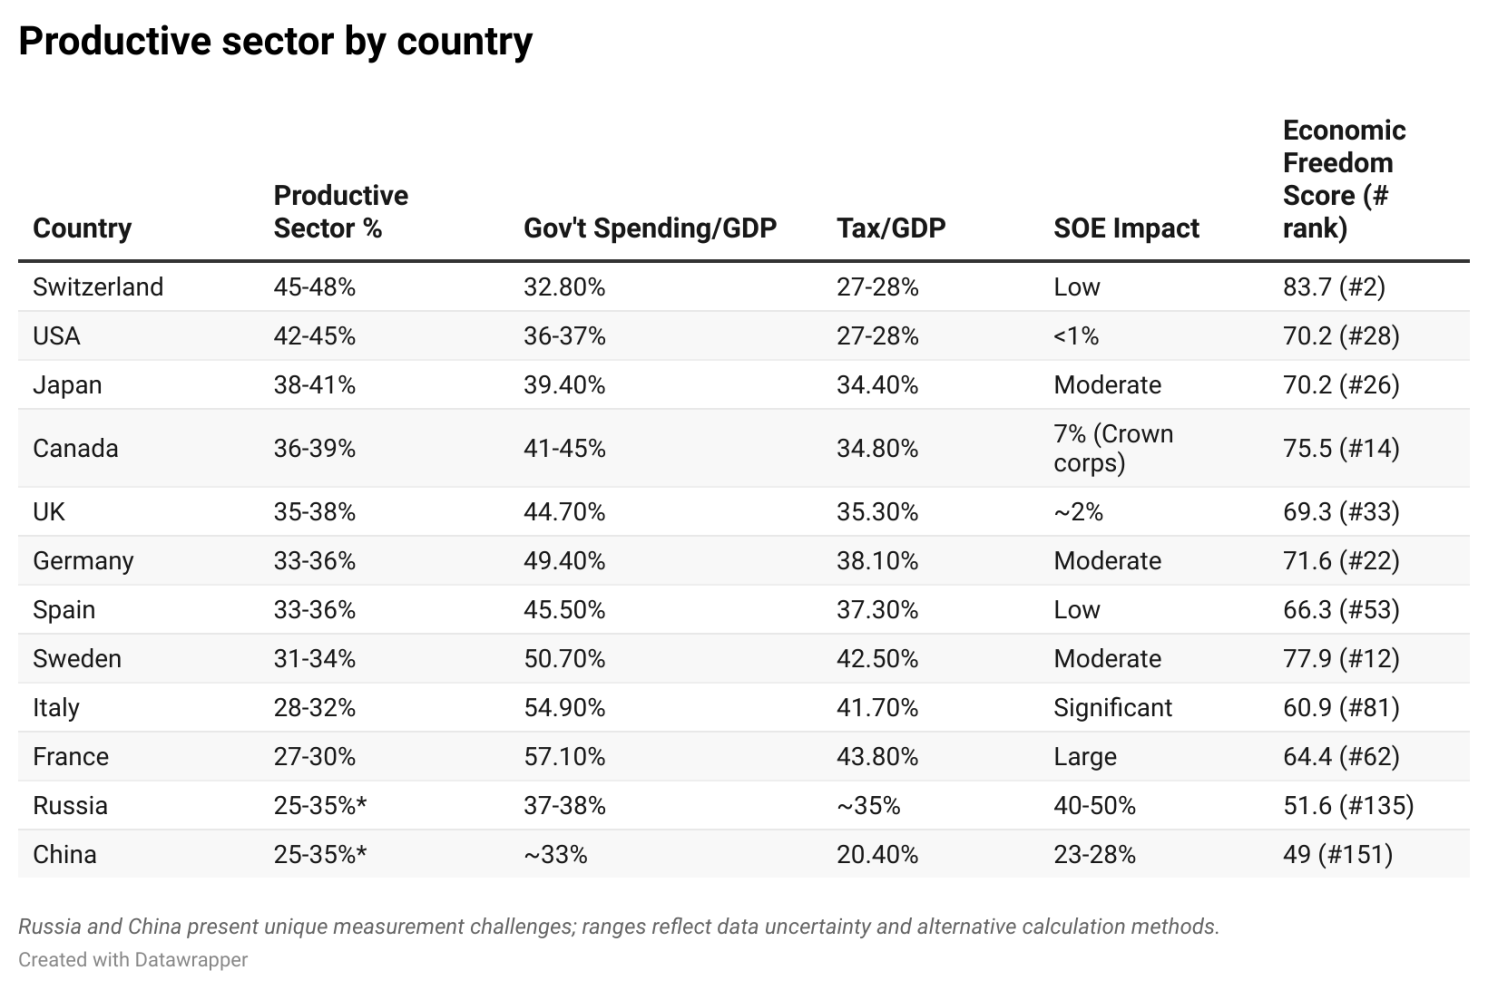
The analysis of 11 major economies through an Austrian economics framework reveals a striking picture: the “productive sector” — economic activity validated by voluntary exchange rather than coercion — ranges from just 27–30% of GDP in France to 45–48% in Switzerland.
This isn't an academic exercise. The data reveals a clear pattern: since 1971, when President Nixon severed the dollar's link to gold, government spending across developed nations has grown from an average of 10–15% of GDP to 35–57% today. Fiat money enabled unlimited expansion. Bitcoin offers the first genuine monetary constraint since that pivot point.
For capital allocators, the implications are profound. If governments consume 40–60% of economic output in most developed nations — and that share continues growing — where should capital flow? Traditional diversification assumes productive sectors remain stable. This analysis shows they don't.
This article presents the complete framework, methodology, and findings from a research series conducted with assistance from Claude AI. Full transparency: Claude helped with data gathering, research execution, and synthesis. The framework, interpretation, and strategic implications are ours. Being transparent about tools matters as much as being rigorous about methodology.
Introduction: Why Measure This?
GDP — the standard measure of economic output — treats all economic activity as equally valuable. A government administrator processing paperwork counts the same as an engineer designing products customers voluntarily purchase. Transfer payments, subsidies, and monopoly rents all contribute to GDP growth.
Austrian economics offers a different lens: productive activity occurs through voluntary exchange, disciplined by profit and loss, competition, and the possibility of bankruptcy. Extractive activity operates through coercion — taxation, monopoly, subsidy — measured by costs incurred rather than value created.
The distinction matters because only productive activity generates genuine wealth. Extractive activity may redistribute wealth, provide services, or pursue policy goals — but it cannot create what doesn't exist.
Understanding the balance between these sectors reveals an economy's capacity for sustainable growth.
This analysis focuses on measuring the percentage of economic activity that operates under market discipline versus state direction for 11 major economies (Switzerland, USA, Japan, Canada, UK, Germany, Spain, Sweden, Italy, France, plus China and Russia).
Methodology: A Systematic Framework
The Calculation
The four-step methodology used here is adapted from Murray Rothbard's “Private Product Remaining” framework:
Step 1: Calculate Gross Private Product (GPP)
- Start with GDP
- Subtract government consumption (direct state provision of goods/services)
Step 2: Identify Total Government Depredations
- Take the maximum of: (a) total government spending, or (b) total tax revenue
- This captures both the extraction (taxation) and the resource claim (spending)
Step 3: Adjust for State-Owned Enterprise Activity
- Subtract estimated value-added from state enterprises
- SOEs lack profit/loss discipline, price signals, and bankruptcy risk
- Cannot verify genuine value creation without market feedback
Step 4: Apply Economic Freedom Adjustment
- Use Heritage Foundation Economic Freedom Index as proxy for regulatory burden
- Accounts for non-fiscal state intervention (property rights, labour regulations, trade barriers)
Productive Sector = GDP (–) Government Consumption (–) Excess Spending (–) SOE Value Added (–) Regulatory Burden Adjustment
Data Sources
This analysis was conducted using the following sources:
- OECD: Government at a Glance 2023 & 2025, National Accounts Statistics
- IMF: Government Finance Statistics, Fiscal Monitor
- Eurostat: Government expenditure by function (COFOG classification)
- Heritage Foundation: Index of Economic Freedom 2024
- National statistics offices: country-specific data verification
- Academic sources: historical spending data, SOE estimates
All sources are documented and available upon request.
Methodological Choices
Government consumption vs. transfers: we count transfer payments (welfare, pensions, unemployment benefits) as extractive even though recipients subsequently spend in markets. The Austrian view: the forced transfer lacks market discipline regardless of where funds ultimately flow.
SOE measurement challenge: most sources provide revenue, not value-added. We used conservative estimates based on OECD SOE databases, country reports, and third-party analysis. For China and Russia, ranges reflect genuine data uncertainty.
Economic freedom as proxy: Heritage Foundation scores aren't perfect, but they systematically capture institutional quality, property rights, and regulatory efficiency — factors that fiscal data alone misses.
Limitations
We acknowledge significant limitations:
- China and Russia data reliability: official statistics likely overstate GDP and understate state control. Independent analysis suggests Chinese GDP may be overstated by approximately 3% annually. Russia has classified trade data since 2022.
- SOE estimation imprecision: particularly for countries with extensive “private” firms under effective state control (China's party supervision, Russia's oligarch system).
- Transfer payment treatment: reasonable economists disagree on whether to count these as pure extraction. We chose the stricter Austrian interpretation.
- Shadow economies: Russia's estimated 40–45% shadow economy means official statistics capture perhaps half of reality.
These limitations don't invalidate the framework — they make absolute precision impossible while preserving relative comparisons.
The Winners
Switzerland leads with a productive sector of 45–48% of GDP. The USA follows at 42–45%. What drives this leadership?
Switzerland: Structural Constraint
Switzerland's advantage is architectural:
- Government spending: 32.8% of GDP (lowest among developed nations)
- Tax burden: 27–28% of GDP
- SOE presence: minimal beyond cantonal utilities
- Economic freedom: 83.0 (#2 globally)
But Switzerland isn't a libertarian paradise. It mandates universal healthcare (delivered through private insurance with competition between providers), subsidises 70%+ of agriculture, and maintains strong labour regulations. The difference: market mechanisms still dominate most economic decisions.
The Swiss healthcare model illustrates the approach — universal coverage through private competitive markets. State mandate plus market delivery maintains some price discipline.
United States: Private Enterprise Tradition
America's structural advantage lies in historical choices:
- Government spending: 36–37% of GDP
- Tax burden: 27–28% (among OECD's lowest)
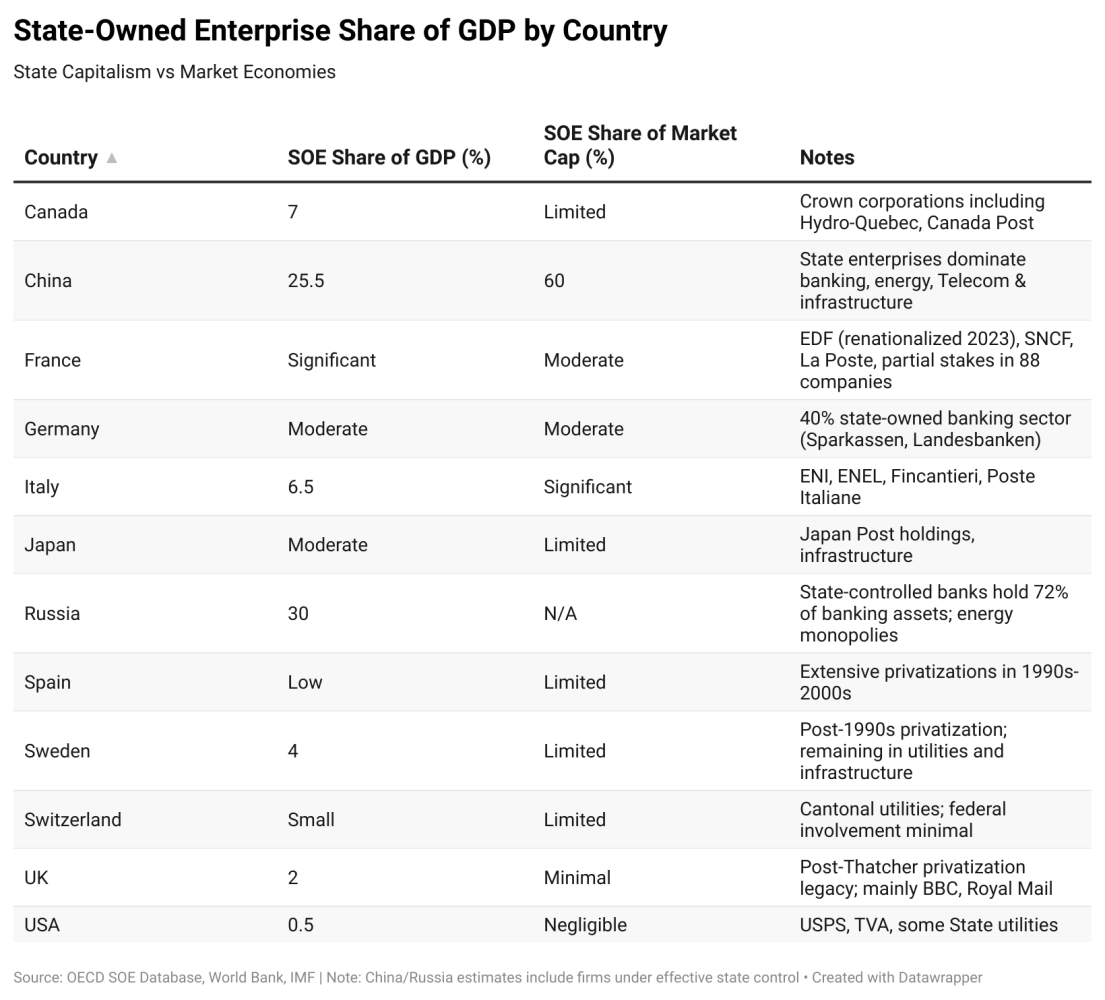
- SOE sector: <1% of GDP
- Private healthcare: 50%+ of health spending
The USA essentially lacks state-owned enterprises: no national oil company, no state banks (North Dakota's public bank being an exception that proves the rule), privatised utilities in most states. This matters more than most realise — it reflects deep-rooted institutional resistance to state enterprise formation.
Even Leaders Have Vulnerabilities
Neither country is immune to expansion pressures. US entitlement spending (Social Security plus Medicare) now exceeds 10% of GDP, and is projected to consume 50%+ of federal revenue by 2035. Recent industrial policy (CHIPS Act, IRA) moves away from market discipline.
Switzerland faces pressure from ageing demographics and European integration demands, though its federalist structure provides some resistance.
Key insight: both countries maintain productive majorities through structural choices made decades ago. Institutions compound over time.
The Losers
France ranks last among developed economies reviewed with a productive sector of just 27–30% of GDP. Italy follows at 28–32%. The trajectory matters as much as the absolute level.
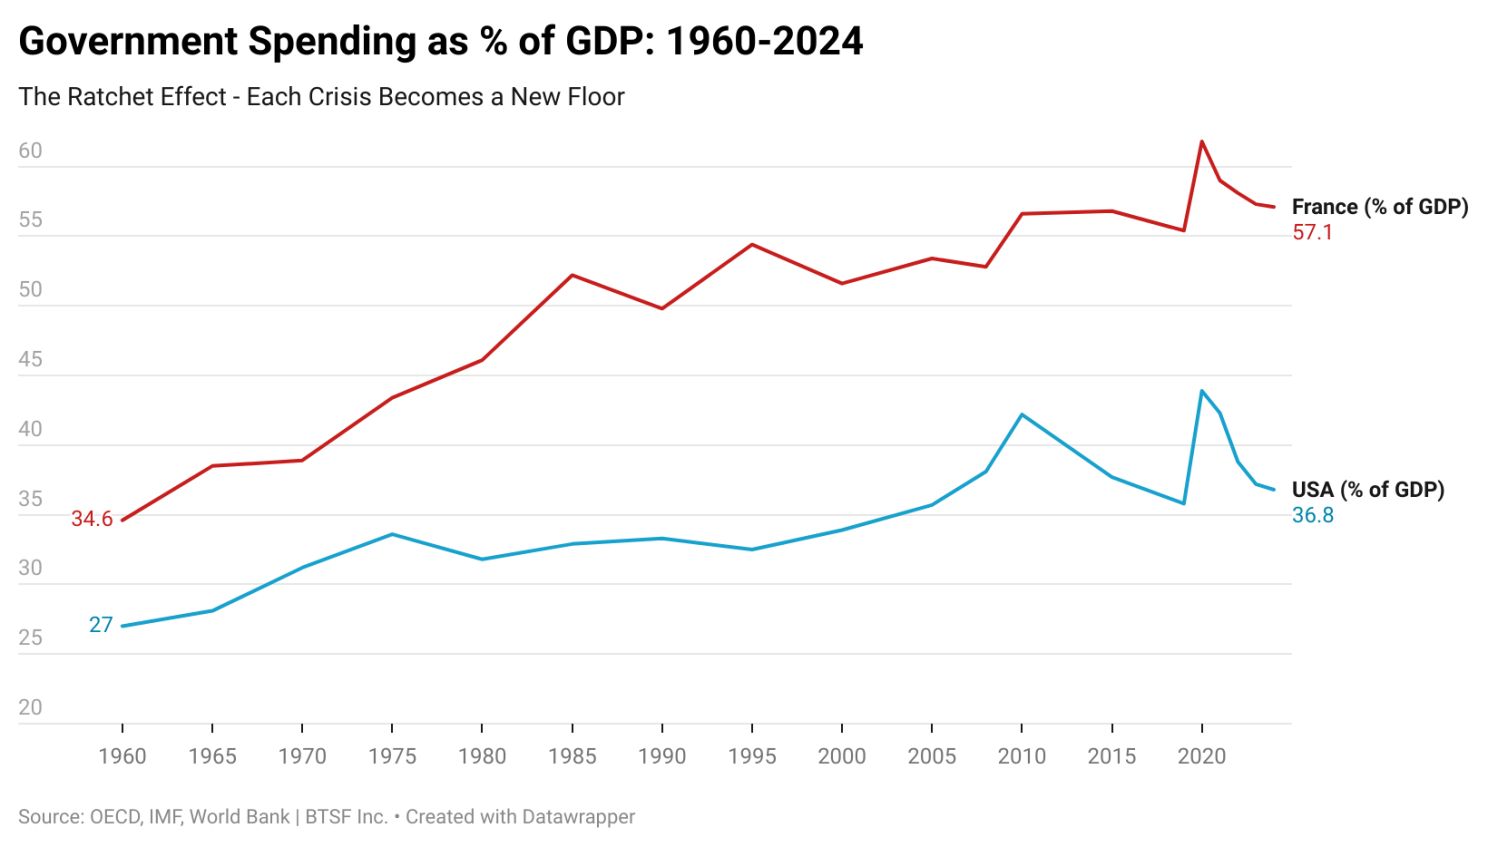
France: The Ratchet in Action
France's government spending tells a 60-year story:
- 1960: 34% of GDP
- 1970: 38% (post-May '68 social expansion)
- 1980: 46% (oil shocks, Mitterrand socialism)
- 1990: 50% (welfare expansion)
- 2008: 53% (financial crisis)
- 2020: 62% (COVID peak)
- 2024: 57% (never fully returned)
Each crisis clicked the ratchet up. Spending rose rapidly during emergencies, fell slightly after, but never returned to the pre-crisis baseline. New floor established. Repeat. France's current state footprint:
- Government spending: 57.1% of GDP (highest in OECD)
- Tax burden: 43.8% of GDP (highest in OECD)
- Social protection: 31.5% of GDP
- Public sector employment: 21.1% of workforce
- State enterprise assets: €732 billion
The EDF renationalisation in June 2023 exemplifies the trend. After partial privatisation in 2005, the state bought back full control for €9.7 billion — moving away from market discipline, not toward it.
Italy: Demographic Trap
Italy's challenge combines demographics with political paralysis:
- Pension spending: 15.5–16.3% of GDP (highest in OECD)
- Government spending: 54.9% of GDP
- Public debt: 134.8% of GDP
- SOE sector: 5–8% (ENI, ENEL, Fincantieri)
Pension promises made when the population was younger now crush the productive sector. The worker-to-retiree ratio collapses while benefits remain politically untouchable. The arithmetic gets worse every year.
A Critical Clarification
We're not saying that French or Italian people are unproductive. The issue is economic structure — too much activity funded by extraction rather than validated by voluntary exchange. Talented people operate in a system that makes wealth creation harder.
Both countries have brilliant entrepreneurs, world-class industries, and deep cultural capital. But the share of economy subject to market discipline keeps shrinking.
The Outliers
Three countries break the simple “big government equals small productive sector” model.
Sweden: The Nordic Paradox
Sweden spends 50.7% of GDP on government — higher than France's government consumption alone. Yet Sweden ranks “Mostly Free” economically (Heritage score ~77). How?
The key distinction: consumption versus transfers.
Sweden's government consumption (direct state provision) equals 25.7% of GDP vs France's 23.3% of GDP. But France's total spending is 57% versus Sweden's 51%. After transfers, Swedes spend in competitive markets.
Sweden's post-1990s crisis reforms preserved market function:
- Privatised major state enterprises
- Pension reform (multi-pillar system)
- School voucher system introducing choice
- Labour market flexibility via collective bargaining
- Strong property rights and rule of law
Our estimate: Sweden's productive sector is 31–34% of GDP. That's low. But institutional quality prevents full collapse into state direction. You can have big government and still maintain market discipline — if you're very careful. Sweden pulled it off. So far.
China and Russia: State Capitalism
China's official government spending: ~33% of GDP. Sounds moderate. It's not. The state controls 40–50% of China's economy through mechanisms fiscal data doesn't capture:
- SOEs produce 23–28% of GDP
- 60%+ of stock market capitalisation
- 40%+ of banking assets
- Party control of all major firms
- State directs investment allocation
“Private” Chinese firms operate under party supervision. Subsidies bypass fiscal accounts: $230.9 billion for EVs (2009–2023), $150+ billion for semiconductors, below-market loans from state banks, free land from local governments.
Russia shows similar dynamics:
- 72% of banking assets state-controlled
- Energy monopolies (Gazprom, Rosneft)
- Defence industry fully state-owned
- Post-2022 war economy expansion
- Shadow economy ~40–45% of GDP
Economic Freedom Scores Reveal Reality
- China: 48.5 (Repressed, #151/180)
- Russia: 52 (Mostly Unfree, #145/180)
- France: 62–63
- USA: 70
- Switzerland: 83
Our estimates for China and Russia productive sectors: 25–35%. Wide ranges reflect data uncertainty. These are fundamentally different systems — the state doesn't just tax, it participates as owner and director.
Key lesson: “government spending percentage” works for Western democracies. It's nearly meaningless for state-capitalist systems. You need ownership plus control plus institutional analysis — not just budgets.
The 1971 Inflection Point
Government spending has grown relentlessly across developed economies for over a century. But the rate of expansion changed dramatically in 1971.
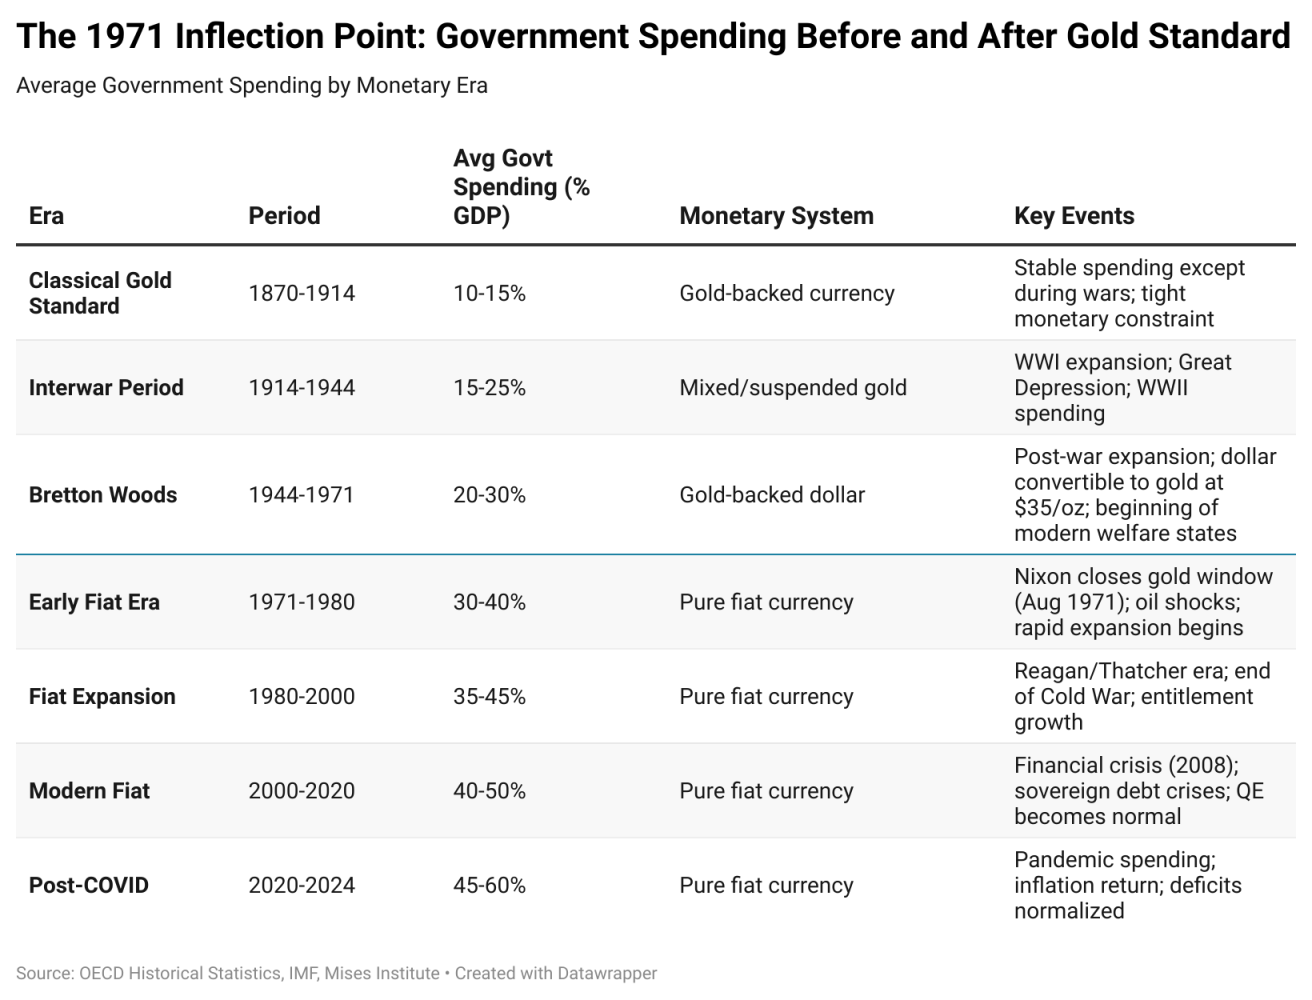
The Gold Standard Era (Pre-1914)
For decades before World War I, government spending across developed nations averaged 10–15% of GDP. Governments faced hard constraints:
- Tax revenue limits
- Borrowing capacity tied to gold reserves
- Currency convertible to gold at fixed rates
Wars temporarily expanded spending, but peacetime levels returned to baseline.
The Ratchet Mechanism
Robert Higgs identified the pattern in “Crisis and Leviathan”:
Crisis → Emergency Spending → “Temporary” Programmes → Crisis Ends → Spending Falls... But Not to Pre-Crisis Level → New Baseline
Each crisis clicks the ratchet up:
- World Wars → veterans benefits, debt service
- Great Depression → Social Security, welfare programmes
- Oil shocks → energy subsidies
- 2008 Financial Crisis → bailouts, expanded safety nets
- COVID-19 → unprecedented transfers, never fully rolled back
Why Spending Never Returns
Public choice economics explains why: every programme creates constituencies that fight to preserve it. Politicians face concentrated benefits (recipients who vote) versus diffuse costs (taxpayers who barely notice individual programmes).
The math favours expansion. Very few countries have managed to significantly reduce government spending. They include:
- Estonia (post-Soviet reforms)
- Chile (post-Pinochet privatisations, now reversing)
- Canada (1990s fiscal reforms)
- Sweden (1990s crisis reforms)
It's possible. But very rare.
The 1971 Pivot
August 15, 1971: President Nixon closed the gold window, ending dollar convertibility to gold. The last link to monetary constraint severed.
After 1971, governments could:
- Print money to finance spending
- Run unlimited deficits
- Inflate away debt burdens
- Face no hard constraint on expansion
The results:
- France: 34% (1960) → 57% (2024)
- USA: 27% (1960) → 37% (2024)
- Similar patterns across all developed nations
The timing isn't coincidental: fiat money enabled unlimited expansion. The Austrian prediction — without hard constraints, governments will consume more of the economy over time — has been empirically validated across 50+ years and dozens of countries.
The Bitcoin Connection: Reintroducing Constraint
Bitcoin represents the first monetary system since 1971 with genuine supply constraint.
Our analysis shows what happened when that constraint was removed. The question is: can Bitcoin reintroduce it?
Bitcoin's 21 million coin limit is often dismissed as arbitrary. It's not. It's architectural. If meaningful wealth moves to Bitcoin, governments face choices they haven't confronted in 50 years:
- Tax visible productive activity (unpopular and mobile)
- Cut spending (politically difficult)
- Borrow (harder when currency debasement fails)
The invisible tax — inflation — disappears as an option.
The Infrastructure Gap
But there's a gap between theory and practice:
- Bitcoin exists ✔️
- Holders exist ✔️
- Miners exist ✔️
- Financial infrastructure that keeps economic activity denominated in Bitcoin: Missing ✘
This is the problem BTSF exists to solve. Not “Bitcoin lending” as a product. But Bitcoin-native credit as infrastructure — enabling economic activity to occur entirely within a hard money system.
The Vision: Productive Sectors on Sound Money
Imagine productive sectors operating under sound money constraints:
- Businesses borrow in BTC, repay in BTC
- Lenders earn yield in BTC
- No inflation tax eroding returns
- Pure market discipline on capital allocation
This isn't speculation. It's architecture.
Bitcoin mining shows why this matters. Miners earn revenue in BTC but face liabilities in USD. This currency mismatch creates structural vulnerability during margin compression. Bitcoin-native credit eliminates that mismatch.
Mining is the first use case. It won't be the last.
The 50-Year Question
We're not building for the next halving or the next cycle. We're building for the next 50 years — when the question shifts from “what's Bitcoin's price?” to “what percentage of global economic activity happens in Bitcoin?”
Infrastructure determines that outcome.
Implications for Capital Allocators
The data from this analysis poses fundamental questions for anyone allocating capital.
The Shrinking Productive Base
If governments consume 40–60% of economic output in most developed nations — and that share continues growing — where should capital flow?
Traditional diversification assumes productive sectors remain stable. Our analysis shows a different picture:
- France's productive sector shrunk from ~66% (1960) to 27–30% (2024)
- Even the USA dropped from ~73% to 42–45%
- Only Switzerland maintained discipline
The trend is clear and consistent.
SOE Risks in Emerging Markets
State-owned enterprise heavy economies carry hidden risks. Official GDP growth may be overstated if 30–40% of activity lacks genuine profitability.
China's property sector demonstrates this perfectly: massive “growth” that destroyed value once market discipline returned. When state-directed investment dominates, price signals fail.
Currency Mismatch Problems
Any enterprise earning revenue in one currency while facing obligations in another bears structural risk. When those currencies are BTC (deflationary) and USD (inflationary), the mismatch intensifies during margin compression.
Bitcoin-native solutions eliminate this mismatch. Capital allocators seeking BTC exposure without currency risk should demand infrastructure that keeps capital in the Bitcoin economy.
The Question of Time Horizon
The Austrian framework we've used isn't predicting rapid collapse. It's documenting gradual crowding out of market-validated activity.
For capital allocators, this raises time horizon questions:
- Short term (1–3 years): France and Italy function despite extractive structures
- Medium term (5–10 years): debt sustainability concerns intensify
- Long term (20+ years): can productive sectors sustain 60%+ extraction rates?
Bitcoin offers an alternative — not through prediction, but through parallel system building.
Conclusion: Measuring Success in Satoshis
After analysing 11 economies across multiple dimensions — government spending, tax burden, state enterprise presence, economic freedom, historical trends — a pattern emerges.
Fiat money enabled government expansion from 10–15% of GDP (gold standard era) to 35–57% today (fiat era). The ratchet operates everywhere. The question isn't whether your country is immune. It's how fast your productive sector shrinks.
Bitcoin reintroduces monetary constraint that's been absent for 50 years. But constraint alone isn't enough. We need infrastructure that enables productive economic activity to occur entirely in sound money — borrowing, lending, investment, trade — all denominated in BTC.
At BTSF, we're building that infrastructure. Not because we predict Bitcoin's price. Because we believe parallel economic systems operating on sound money can outcompete those operating on unlimited fiat expansion.
We measure success in satoshis — not dollars. That's the point.
A Note on Methodology and Collaboration
This analysis represents significant research conducted over one week, with assistance from Claude AI (Anthropic). Claude helped with data gathering, research execution, and synthesis. The framework, interpretation, and strategic implications are ours. Claude was a tool — a powerful one — but a tool nonetheless.
We're transparent about this because intellectual honesty matters. The future of research involves human expertise guided by AI capability. Pretending otherwise serves no one.
For Further Discussion
The complete methodology with detailed data sources and country-specific breakdowns took significant research time. Rather than publish it all publicly, we're happy to share with anyone genuinely interested in the framework.
Capital allocators, mining operations, Bitcoin infrastructure builders — if you're thinking about these problems, let's talk.